|
|
|
|
|
|
|
|
|
|
|
|
|
|
 |
||
| D. Warner North :: Publications | ||
Assessing Risks in Long-Term Planning: Probabilistic Scenario Analysis with Generalized Equilibrium Energy ModelsD. Warner NorthNorthWorks, Inc., Belmont CA, USA; and Department of Management Science and Engineering, Stanford University, Stanford, CA USA Paper presented at the RIMS-2006 VNIIGAZ/GAZPROM Conference, Moscow, Russia, February 1-2, 2006 (Minor editorial changes have been made subequent to this conference.)
This paper provides a brief introductory summary of methodologies that have been used in the United States for long-term planning of large energy investments that require extensive capital investment and development of technology. It is expected that such methods may be useful to GAZPROM and to its export customers in connection with planning and financing development of additional gas fields in the high arctic area of Russia and pipeline construction to bring such gas to export markets, such as the Baltic countries and other portions of Western Europe. There are two methodologies involved: (1) the use of probabilistic scenario analysis to examine changes in market conditions, including political events that may limit or disrupt energy supply to customers; (2) the use of large-scale energy models that project how market conditions including energy prices and the mix of energy materials may evolve under specific scenarios. The example presented will be the analysis prepared for the US Presidential Task Force in 1975, when the US Government was considering a massive investment in new facilities to make liquid and gaseous fuels from coal and oil shale. This program was subsequently implemented, proved to be a market failure, and was therefore discontinued. The reasons for the market failure were clearly evident in the 1975 analysis. The author will present a retrospective review of this 1975 analysis, in which he was a participant, and an update on the energy modeling and probabilistic scenario methodologies as these have evolved in thirty years of subsequent use by US energy and risk specialists.
I. History and Background
At the midpoint of the first decade of the 21st century, oil and gas resources are depleting. Western Europe will need increasing amounts of imported oil and gas to meet its energy needs. There are also special situations. For example, the government of Lithuania has agreed as a condition for its membership in the European Union to shut down the Ignalina Nuclear Power Plant (NPP) [1]. This plant has two 1500 MW nuclear generating units of the graphite channel (RBMK-2) type, the same design as for the Chernobyl NPP in the Ukraine. Ignalina NPP was built during the time of the Soviet Union to provide electricity for the Baltic region, and it became a part of Lithuania when Lithuania became an independent country. Its 3000 MW generation capacity has allowed Lithuania to meet most of its own needs for electricity from this NPP and also to export large amounts of electricity to Latvia, Estonia, Belarus, and the Russian Federation. Unit one was shut down at the end of 2004. The second unit is scheduled to be shut down in 2009. Shutting down these two nuclear units will require that this electric generation be replaced by other energy sources, such as natural gas from Russia or a heavy oil/water mixture called orimulsion from Venezuela.
Increased reliance by European countries on natural gas from Russia has positive features for these countries and also for Russia. Russia has extremely large natural gas resources that can be developed and transported to European countries for costs that should be competitive with other energy sources. Natural gas does not contain sulfur, nitrogen, metals, or complex hydrocarbons, so control of air pollutants such as sulfur oxides, nitrogen oxides, and particulate matter is inherently much more easily accomplished; pollution control equipment is needed only for management of oxides of nitrogen formed from atmospheric nitrogen in the combustion process. The low carbon content of natural gas compared to oil and coal implies lower levels of carbon dioxide emissions into the atmosphere, compared to burning coal or oil. More use of natural gas, instead of coal or oil, therefore reduces global climate alteration. For these reasons natural gas will increasingly be viewed as a premium fuel, for which customers are willing to pay a higher price. Production areas of natural gas in Western Europe such as in the North Sea are depleting, and large new gas resources are unlikely to be discovered. Russia is known to have very large gas resources that are only now beginning to be developed, such as the Shtokman field. These resources could provide ample supplies for European consumers for much of the 21st century, and may permit export of liquefied natural gas (LNG) to North America as well. [2]
Development of Russian natural gas for export to European countries will require considerable capital expenditure, including the construction of new pipelines and development of gas fields in the arctic region. While agreement was reached between GAZPROM and German companies last year to construct a new gas pipeline to provide Russian gas to Germany, the Baltic countries and Poland expressed concern that this pipeline would bypass them and leave them dependent on single pipelines from Russia. The countries would have preferred an alternative overland route. The 2004 interruption of gas supply to Belarus and the New Year�s Day interruption of gas supply to the Ukraine, and the recent terrorist attacks on the pipelines to Georgia have increased concerns among Europeans that the supply of gas from Russia may not be reliable. Events such as equipment breakdowns and extreme weather can lead to supply interruptions. The planning of the multibillion dollar investments in gas field development and pipeline construction will depend on perceptions that (1) the price of the natural gas to customers will be competitive with other energy sources, and (2) that supplies will be reliable. There must be assurances that neither politically motivated shutdowns, equipment failures, extreme weather, or acts of terrorism or war will disrupt the transport of gas essential for heating and continued function of the economy in countries depending on natural gas imports. Alternative supplies energy are available to Europe through North Africa, the Middle East, and possibly from Central Asia, especially as new pipelines or LNG facilities are constructed.
What is needed for planning is methodology to deal with two issues: (1) a way of assessing the competition in price between gas from Russia and other energy materials for meeting the needs of European countries, looking forward for decades (2) a way to assess the uncertainties arising from weather, equipment failures, and political events to plan adequate redundancy in the energy supply system to that the probability of significant supply interruption can be made acceptably low. Multiple natural gas pipelines connecting gas fields to customers, underground gas storage located in customer countries, and provision to obtain and use other supplies under upset conditions may be needed to assure adequate supply reliability. The cost of these facilities needed for adequate supply reliability should be included in calculating what it will cost to provide gas from Russia to serve export markets in Europe. Therefore, the two issues must be linked.
II. Methodology Needed
Analytical Tools Area #1 � Probabilistic Risk Analysis: A shortfall or failure in a complex system often can be described as a scenario, a set of events leading to this failure. Probabilistic models of such event sequences have a long history in statistics and reliability theory. Such approaches were developed in the aerospace and nuclear power industries and then widely applied in these industries and elsewhere. Decision analysis evolved out of statistical decision theory in the aftermath of World War II. In decision analysis, sequences are examined of decisions and uncertain events. A decision tree is often used as a visual display and as a computing device for computing the probability distributions corresponding to different decision alternatives, and then evaluating these to find the best decision. [11].
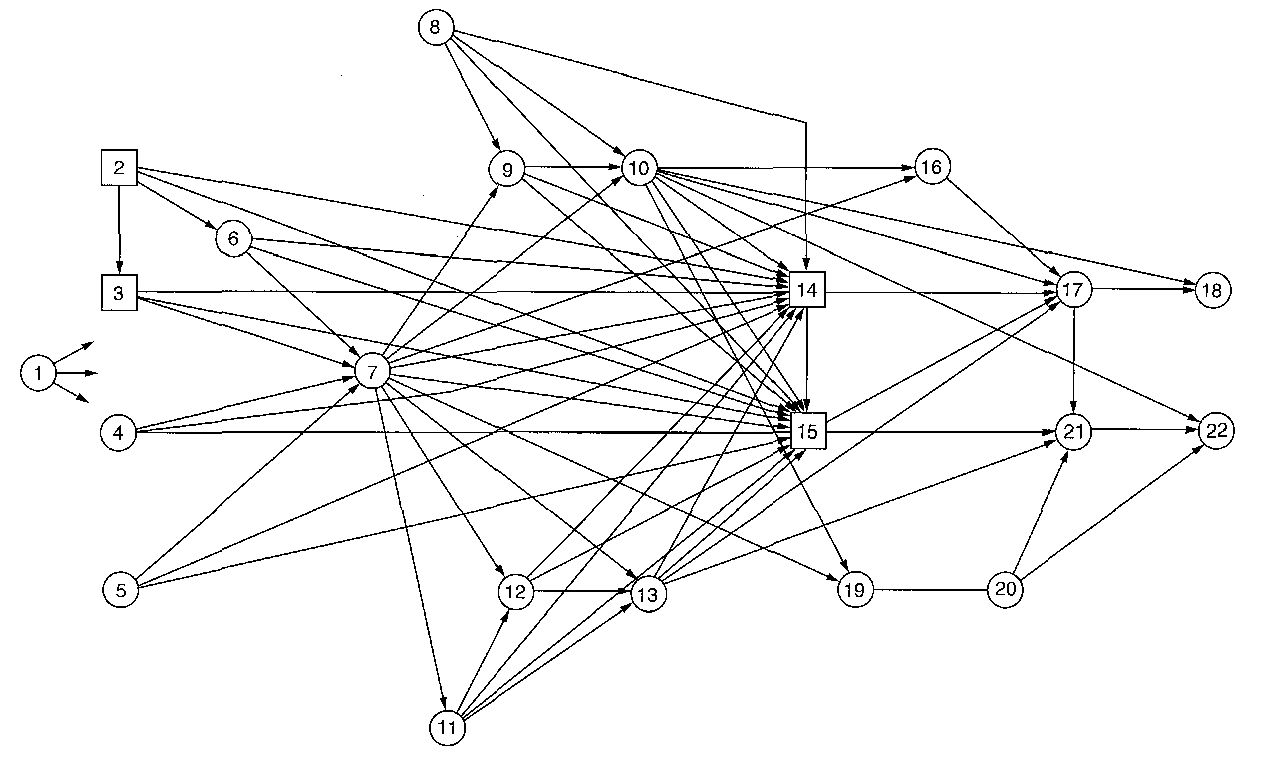
Influence diagrams [6,7,8] evolved from decision trees to deal with situations in the sequence of decisions and events has a complex structure of conditionality. For example, a series of ten to twenty uncertain events precedes the system failure of interest, and the probabilities assigned to one of these events may depend on some (say, 2 to 6), but not all of the preceding events and decisions in the sequence. With binary (two possible outcomes) events, a sequence of ten events leads to a thousand end points or scenarios, and 20 leads to a million. An illustration of such a tree showing all the possible outcomes becomes impractical except in a generic form. The influence diagram is a schematic form that shows by means of arrows connecting decisions and events (collectively referred to as �nodes�) the conditionality structure. Influence diagrams have achieved widespread use in decision analysis, operations research [12] reliability [13] and also in computer science applications, sometimes under the term, Bayesian nets. A recent application to protection against terrorism by the author�s department chairman at Stanford and one of her students is found in [14]. Software packages for influence diagram computations are available from several sources. For the illustrative example below, the author has used Decision Advisor, a propriety software package for R&D management marketed by SmartOrg of Menlo Park, California, USA.
Failure of the natural gas supply system to meet gas demand might result from four types of events:
The arrows show conditionality for dependence of the uncertain events on preceding events. For example, we assume that a failure of the system to meet peak demands as the result of extreme weather depends on whether the extreme weather occurs (and perhaps to what extent) and on the configuration of the pipeline and storage system. An analysis might consider a base case and several alternatives in which additional investment has been made to have storage facilities and one or more additional pipelines from the supplier country. For each system configuration and each of the weather outcomes, a probability is assigned to each of the cases for a supply shortfall. We show below in Figure 2 a decision tree representation: two outcomes for extreme weather (yes and no), three systems configurations (base and two alternatives) and two possibilities for shortfall (shortage and none).
Moving from left to right and then down the influence diagram in Fig 1, probabilities are assigned to �terrorist attack,� conditional on which of these outcomes occurs and the system configuration alterative. �Deliberate flow restriction� is shown conditioned only on �supplier political evolution.� Once probabilities are assigned to all the possible outcomes for each event and decision, a composite probability can be computed for each possible path or scenario. Figure 3 shows the probability distribution computed for illustrative numbers in this highly simplified influence diagram.
The approach is capable of using a much more complex structure of decisions and uncertain events conditionally dependent on preceding decisions and events (nodes) in the influence diagram. For the other three terms, we have conditioned equipment failure only on the configuration decision, and we condition �terrorist attack� on �supplier political evolution.� �Deliberate flow restriction� is also conditioned on what happens in �supplier political evolution.� This node is intended to describe what might happen politically in eastern European countries during the next 5-15 years. A very simple characterization of three mutually exclusive, collectively exhaustive outcomes for one or more countries might be: continued steady progress in democracy, protracted civil unrest, and reversion to authoritarian imperialism. Probabilities may be assigned to each of these outcomes, based on the judgment of experts in the politics of the area. Disagreement among such experts can be expected. Which judgments are most important? Sensitivity analysis can help determine which judgments are most important in influencing the overall probability of supply interruption and its economic and social consequences.
Once the set of conditional probability assignments are complete and outcomes for �unmet demand� resulting from the four sets of causes are described, then the software can compute probability distributions for each configuration, so that costs and risks of supply interruptions of different time periods and regional impact magnitudes can be compared. An illustrative cumulative distribution is shown below in Figure 3. It shows a moderate probability (about 7%) of a limited shortfall judged to be worth about
� 1 billion, and a much smaller probability (0.7 %) of a much larger shortfall, valued at
� 60 billion. Such a disaster would be comparable to the impacts the US has experienced from the Gulf Coast hurricanes in 2005. A disaster of this magnitude might plausibly result from a major, extended interruption, perhaps from a series of successful terrorist attacks, civil unrest, or an extreme action, or series of actions to reduce supply from gas sources and deliberate shutdown of pipelines.
The structure shown in Figure 1 here is intended only as a highly simplistic description of the methodology, for those not familiar with influence diagrams and probabilistic risk analysis. Applications of probabilistic risk analysis to weather and equipment failure are widely carried out by gas and electric utilities. Application to the threat posed by terrorism and political decisions to interrupt supply are not widely practiced. It may be useful to carry out such an analysis as the basis for dialogue among the concerned parties. For example, some parties in Russia may assert that the threat of terrorist attack in Lithuania and other Baltic countries led to a preference for the Baltic undersea pipeline route over the cheaper overland route. Figure 4 and influence diagrams of similar complexity in [14] illustrate how complex sequences of events may be represented suing influence diagrams as a means of assessment expert judgment for probabilistic risk analysis.
Analytical Tools Area #2: Energy Models for Long-range Planning: Planning the future of a complex energy system on a time scale of many decades is a daunting challenge. Dating back at least to period in the 1970s when the United States was considering large investments in new energy systems, such computer planning models are increasingly being used by businesses and government agencies.
Stanford University has since the 1970s had an activity called the Energy Modeling Forum, in which leaders in the field of energy modeling bring their models (often proprietary computer software, developed at considerable investment expense) and come together to analyze case exercises, from regional planning to global response in the context of global climate change. Reference [15] is a report on dealing with natural gas supply in North America. One of the models used in the exercise described in [15], the North American Gas Model (NARG), is a direct descendent of the SRI-Gulf model used for the synthetic fuel commercialization analysis described in [3] and [4]. In [15] this model was being used on behalf of the California Energy Commission; it has also been used for many leading US and international oil and gas companies. The lead modeler, Dale Nesbitt, worked with the author on the 1975 synthetic fuel analysis ([3] and [4]). The generalized equilibrium methodology involves an extension from mathematical programming to finding the fixed point solution x to an equation f(x) = x, where x is a vector of very high dimensionality describing flow quantities and prices of energy materials at different locations in a network connecting energy resources in the ground to energy end use demands, and at different time points from the beginning to the end of the planning horizon [16,17]. The NARG model and its European counterpart, the European Gas Model, are not unique to one vendor. Argonne National Laboratory (ANL) and Rice University have developed similar models based on the generalized equilibrium approach. Other modeling and simulation approaches can be used to forecast how the competition may evolve between natural gas from Russia, natural gas from other sources, and competing fuels and technologies for meeting Europe�s needs.
Understanding how the European energy system may evolve over a period from now to the middle of the twenty-first century can be greatly aided by the use of advanced energy modeling tools. Energy models are particularly useful for projecting changes as energy prices and the availability of energy technologies change over time. The models can also be used to analyze upset conditions, such as those that occurred in the US during the last half of 2005 because of hurricane damage.
III. Combining Both Analytical Tool Areas: the 1975 Synthetic Fuels Analysis
The 1975 analysis [3,4] of the US decision on investing billions of dollars to create a million-barrel-per-day industry to make gas and liquid fuels from coal and oil shale showed that this investment was a poor idea. The program proposed in the President�s State of the Union was first scaled down to a smaller program of one commercial scale plant of each technology, a total capacity of 1/3 of a million barrels per day. This smaller program was proposed by President Gerald Ford but voted down by the US Congress. Under the next President, Jimmy Carter, a small synthetic fuels program was established. The program failed badly, for reasons that were foreseen in the analysis: The increased prices of oil and other energy materials that occurred in the mid-1970s led to reduction in demand, and also to expansion of conventional oil and gas supplies, with the result that there was no market for high-cost synthetic fuel made from shale and coal. The Great Plains Coal Gasification plant was built, but it was not able to sell its gas product, because the price of gas was below the operating cost to produce gas from this plant. There was no return of profit to offset the high capital cost of the plant. The plant was therefore abandoned, with the loss of the capital cost of its construction at the expense of the US government.
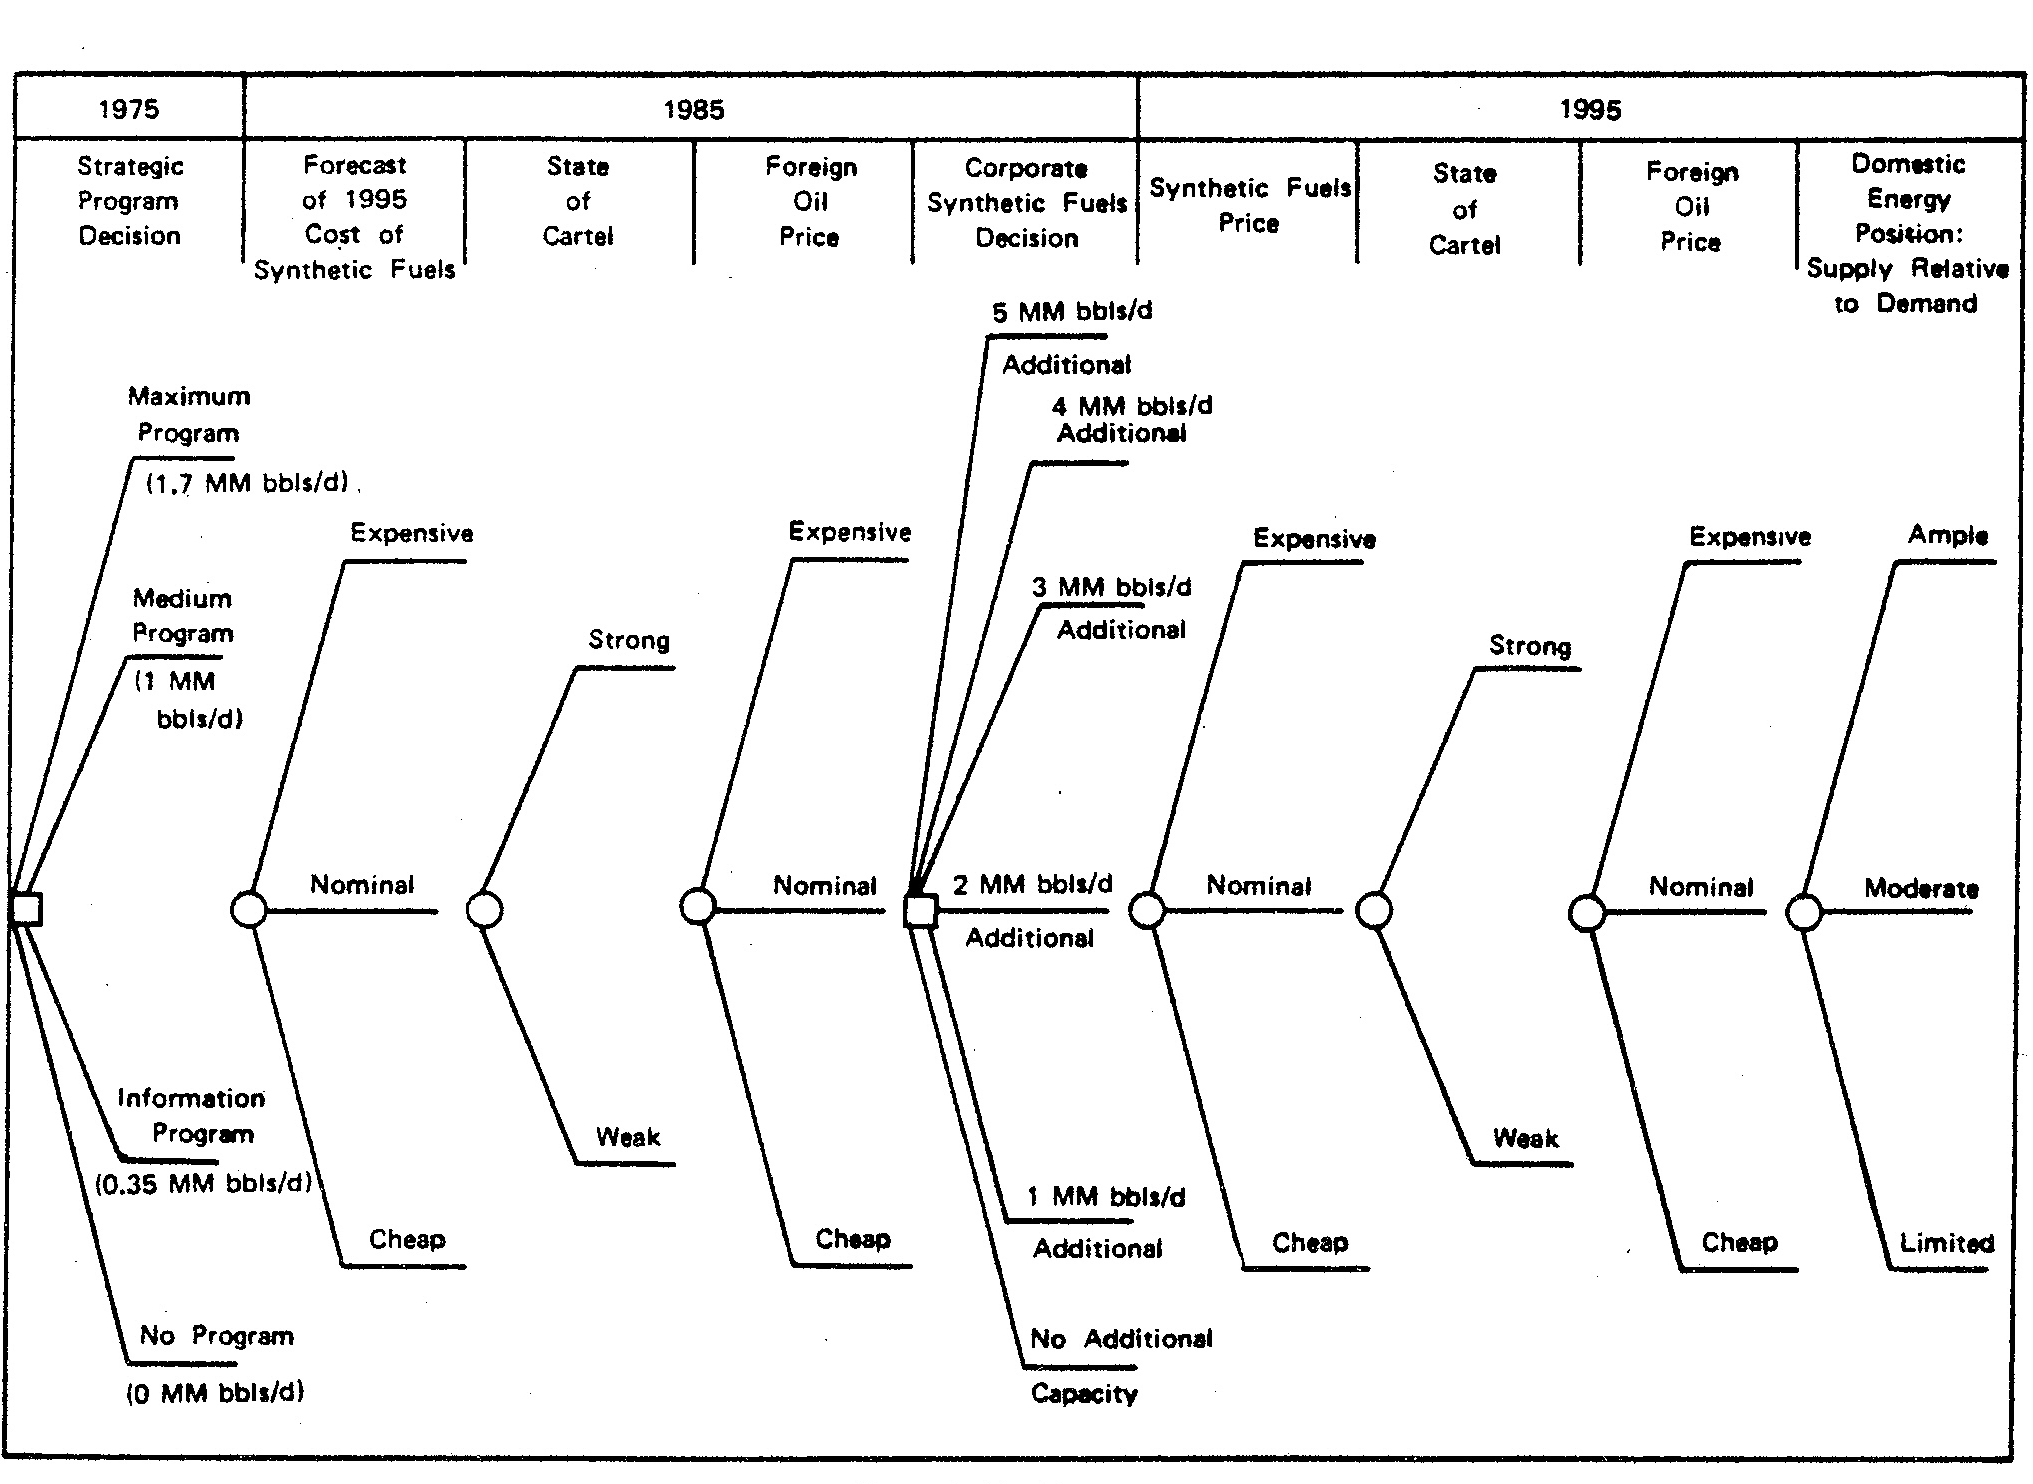
The analytic tools used for the analysis ([3] and [4]) included the decision tree shown in Figure 5 describing important uncertainties and how future decisions to expand capacity would depend on the immediate decisions to be taken in the mid-1970s. Many thousands of scenarios were represented in the decision tree, and across this large number of scenarios (with some approximations via curve fitting) an energy model was used to assess how prices, technology choices, and energy quantities might evolve for that scenario.
A number of other analyses were carried out in the US in the late 1970s using multiple scenarios and energy models. A review of some of these analyses appears in [18]. The synthetic fuels analysis was one of the most elaborate, and it was tightly focused toward one specific government policy decision. It should be a useful example to Russian and European Union experts in analysis of specific alternatives, such as new pipelines and LNG transport facilities, for supplying reliable natural gas and other energy materials to Europe in the coming decades.
IV. Needs for Future Planning and Decision Making
In planning Europe�s energy future, the leadership in energy companies and governments need to work effectively together, and to overcome legacies of mistrust and misunderstanding that come from many historical events and from differences in institutions and cultures. Effective planning and decision making require not only the mastery of analytical methods for dealing with the complexity and uncertainty of energy markets and technological development, but also learning how effective governance can be achieved among a multiplicity of stakeholders � national governments, the European Union and the G-8, energy companies, and concerned citizens in many countries. It is not just a technical problem - it is also an extreme social and political challenge! Several recent reports have suggested how decision analysis methods can support improvements in risk governance in order to improve the transparency and effectiveness of national and international dialogue [19, 20, 21].
In the Preface to the National Energy Strategy for Lithuania ([1], page 5), Dr. Jurgis Vilemas writes, �Decision-making will hopefully, in the end, be based on economic reasoning, realistic demand forecasts and the latest achievements in development of energy generation technology.� This is an excellent place for planning to start, and the author looks forward to working with Dr. Vilemas and his colleagues on a study of how to meet the energy needs of the Baltic Region. This analysis will be broadened from a focus on purely economic reasoning to include the four types of risk issues that have been listed in this paper and illustrated in the simple influence diagram: extreme weather, equipment failure, terrorism and sabotage, and political interference in energy trade. The author hopes that the RIMS-2006 participants, the management of VNIIGAZ and GAZPROM, and the leadership of energy planning for Europe share this expanded view on what needs to be done to support good decision making for the energy future of Russia and Europe.
References
[1]. J. Vilemas, V. Mi�kinis, and A. Galinis, National Energy Strategy, Prepared for, and approved by, the Seimas (Lithuanian Parliament) on 10 October 2002, Lithuanian Energy Institute, 2003.
[2]. Tristana Moore, �Gazprom�s Global Ambitions,� BBC News, Tuesday 20 December 2005.
[3]. Synfuels Interagency Task Force, Recommendations for a Synthetic Fuels Commercialization Program, report prepared for the President�s Energy Resources Council, November 1975, Washington, DC: US Government Printing Office.
[4]. S. N. Tani, �Decision Analysis of the Synthetic Fuels Commercialization Program,� The Principles and Applications of Decision Analysis, Menlo Park, CA: Strategic Decisions Group, 1989.
[5]. Stephen M. Barrager, Bruce R. Judd, and D. Warner North, The Economic and Social Costs of Coal and Nuclear Generation, Report Prepared for the National Science Foundation by Stanford Research Institute, Menlo Park, CA, March 1976.
[6]. Allen C. Miller, III, James. E. Matheson, Miley W. Merkhofer, Thomas R. Rice, and Ronald A. Howard, Development of Automated Aids for Decision Analysis, Final technical report prepared for the Defense Advanced Research Projects Agency (DARPA) by Stanford Research Institute, Menlo Park CA, May 1976.
[7]. Ronald A. Howard and James E. Matheson, �Influence Diagram Retrospective,� Decision Analysis 2:144-147 (2005).
[8]. Ronald A. Howard and James E. Matheson, �Influence Diagrams,� Decision Analysis 2:127-143 (2005).
[9]. D. Warner North, �EPA�s Draft Reports to Congress on Global Warming: An Overview from 1990.�
[10]. D. Warner North and Stephen H. Schneider, �Global Climate Change: A Survey of the Science and Policy Implications,� in press for conference report publication, 2006.
[11]. Robert T. Clemen, Making Hard Decisions: An Introduction to Decision Analysis, Belmont, CA: Duxbury Press, 1991.
[12]. Ross Shachter, �Evaluating Influence Diagrams,� Operations Research, 34:871-882, 1986.
[13]. Reliability and Decision Making, Richard E. Barlow, Carlo A. Clarotti, and Fabio Spizzichino, editors, London: Chapman and Hall, 1993.
[14]. Elisabeth Pat�-Cornell and Seth Guikema, �Probabilistic Modeling of Terrorist Threats: A Systems Analysis Approach to Setting Priorities Among Countermeasures,� Military Operations Research 7(4):5-23, 2002.
[15]. Stanford Energy Modeling Forum, Natural Gas, Energy Diversity, and North American Energy Markets, report on EMF 20, Stanford University, September 2003.
[16]. Edward G. Cazalet, Generalized Equilibrium Modeling: The Methodology of the SRI-Gulf Energy Model, report prepared by Stanford Research Institute for the Federal Energy Administration, May 1977.
[17]. Horace W, Brock and Dale M. Nesbitt, Large Scale Energy Models: A Methodological Analysis, report prepared by Stanford Research Institute for the National Science Foundation, May 1977.
[18]. James Just and Lester Lave, �Review of Scenarios of Future US Energy Use,� Annual Review of Energy, 4:501-36 (1979).
[19]. National Research Council, Understanding Risk: Informing Decisions in a Democratic Society, Washington DC: National Academy Press, 1996.
[20]. D. Warner North and Ortwin Renn, �Decision Analytic Tools and Participatory Decision Processes,� �State of the Science� paper prepared for the National Research Council Panel on Public Participation in Environmental Assessment and Decision Making, March 2005. Available on the web through http://www7.nationalacademies.org/hdgc/Public_Participation.html, then Quickplace link to reach documents as Tab 12. (Requires sign-up but no cost to access). A final report from this Panel of the National Research Council is expected in late 2006.
[21]. Ortwin Renn,
Risk Governance: Towards and Integrative Approach, White Paper #1, International Risk Governance Council, Geneva, Switzerland, September 2005.
|
The Author
D. Warner North is President and Principal Scientist at NorthWorks, Inc.,
|